Tracing and profiling machine learning dataflow applications on GPU
 Image credit: Unsplash
Abstract
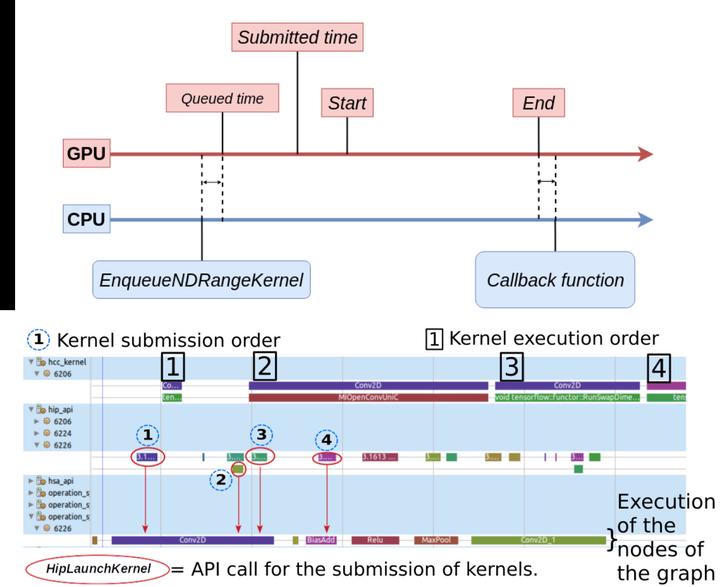
In this paper, we propose a profiling and tracing method for dataflow applications with GPU acceleration. Dataflow models can be represented by graphs and are widely used in many domains like signal processing or machine learning. Within the graph, the data flows along the edges, and the nodes correspond to the computing units that process the data. To accelerate the execution, some co-processing units, like GPUs, are often used for computing intensive nodes. The work in this paper aims at providing useful information about the execution of the dataflow graph on the available hardware, in order to understand and possibly improve the performance. The collected traces include low-level information about the CPU, from the Linux Kernel (system calls), as well as mid-level and high-level information respectively about intermediate libraries like CUDA, HIP or HSA, and the dataflow model. This is followed by post-mortem analysis and visualization steps in order to enhance the trace and show useful information to the user. To demonstrate the effectiveness of the method, it was evaluated for TensorFlow, a well-known machine learning library that uses a dataflow computational graph to represent the algorithms. We present a few examples of machine learning applications that can be optimized with the help of the information provided by our proposed method. For example, we reduce the execution time of a face recognition application by a factor of 5X. We suggest a better placement of the computation nodes on the available hardware components for a distributed application. Finally, we also enhance the memory management of an application to speed up the execution.